Tesla Q3 2026: Higher Gross Profit, Lower Operating Income
Tesla’s quarterly update dated 21 October 2026 presents a useful distinction between gross profit and operating earnings. In the third quarter, gross profit increased, but a larger operating-expense bill left operating income below the year-earlier level.
For readers following the car industry, this shows why revenue or vehicle sales alone cannot explain an automaker’s performance. The cost of running and developing the wider business also matters.
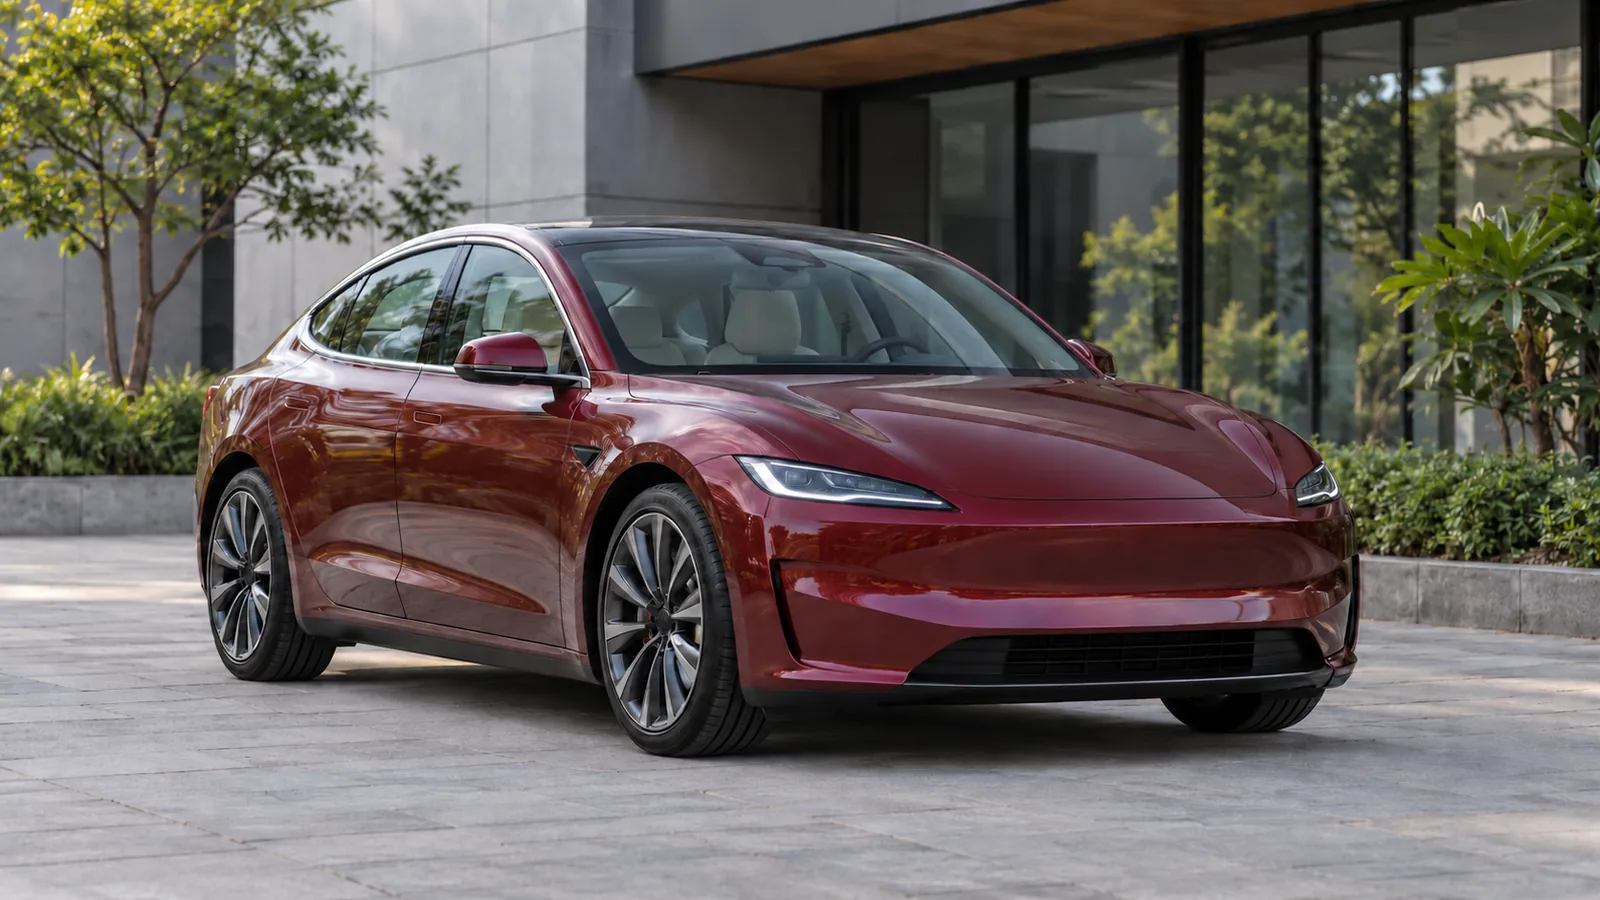
Cover: AI-generated illustration of a generic, unbranded electric sedan in an Indian commercial setting. It does not depict an actual Tesla model or an official vehicle design.
Tesla Q3 2026 results: What changed?
| Group metric, US$ million | Q3 2025 | Q3 2026 |
|---|---|---|
| Total revenue | 28,095 | 28,046 |
| Gross profit | 5,054 | 5,494 |
| Operating expenses | 3,430 | 4,776 |
| Income from operations | 1,624 | 718 |
| Operating margin | 5.8% | 2.6% |
Source: Tesla’s unaudited financial summary and statement of operations. These are group figures, including businesses beyond vehicle sales.
Why did higher gross profit not lift operating income?
Tesla attributes operating-expense growth to research projects, stock-based compensation and selling, general and administrative costs. Its explanation also identifies lower regulatory-credit revenue and weaker energy-business gross profit among the pressures on operating income. Source: year-over-year financial summary.
Gross profit is measured before operating expenses. A business can therefore improve the difference between revenue and direct costs while earning less after research, administration and other operating spending. The table shows that distinction without requiring a conclusion about whether every individual product became more profitable.
Our assessment is that the commercial question is how effectively development spending translates into products, capabilities and customer demand. Higher expenditure is an input to that process; its eventual return needs evidence from execution and results.
What does the automotive revenue line tell us?
Total automotive revenue was US$20.560 billion, down 3% year on year. Tesla also identifies lower vehicle average selling prices, including mix effects, among the factors affecting group revenue. Source: financial and year-over-year summaries.
That is broader than a price list for a particular market. Product mix, the regions in which vehicles are sold and the items included in a reporting category all need consideration before drawing a conclusion about an individual purchase.
What should Indian car buyers take from the results?
Use the update as context for Tesla’s business performance. It does not replace an India-specific vehicle quotation, equipment list or written delivery commitment. A change in global operating earnings cannot establish the discount a buyer will receive.
When comparing a car, identify the exact version and separate the included equipment from optional software, accessories and ownership packages. Ask for the complete payable amount and the applicable terms. Judge the delivered vehicle and support arrangements alongside the broader company story.
The practical decision remains whether the car meets your driving, parking and ownership needs at a cost you can sustain. A quarterly financial headline is only one part of that assessment.
Check affordability before shortlisting
Check your indicative eligible amount and estimated EMI with AutoCred before shortlisting or visiting a dealer. Compare the indication with the written vehicle quote and your household budget. Results are indicative; final eligibility, rate, tenure and approval depend on the lender.