Tesla Q3 2026 Deliveries: Quarterly Growth, Annual Decline and Model Mix
Tesla's latest quarterly vehicle release presents two different comparisons: deliveries improved from the previous quarter but remained below the year-earlier total. For readers following the electric-car market, both comparisons matter. Choosing just one can make the same period look stronger or weaker than the full picture supports.
This analysis uses Tesla's official production and delivery tables, reviewed on 18 October 2026. These are global company figures, not India sales or registration statistics.
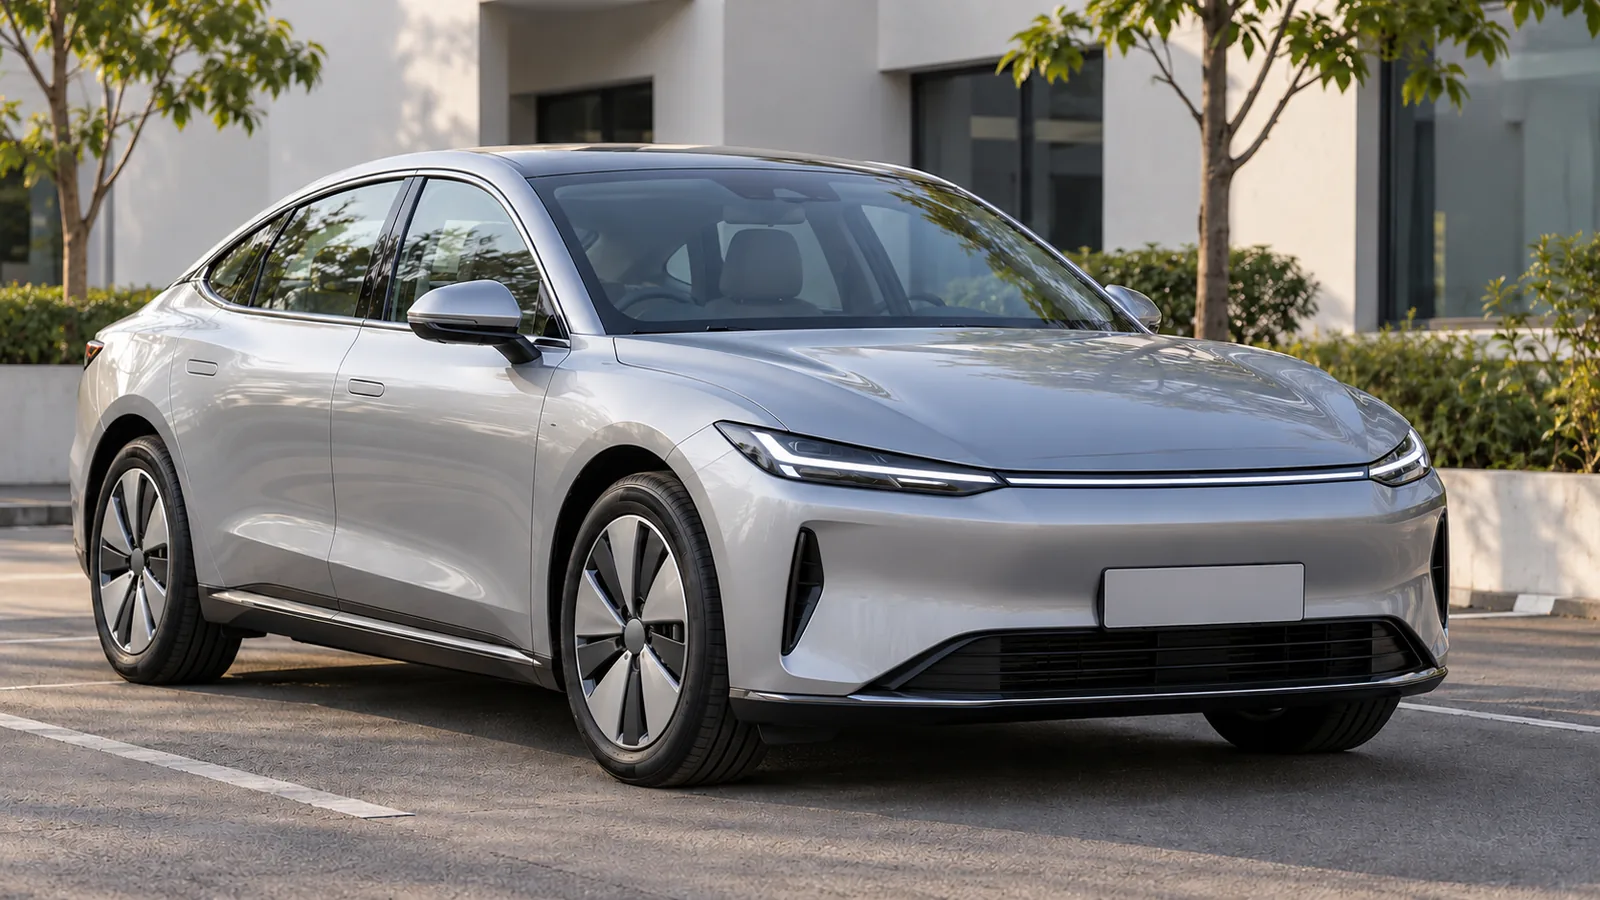
Cover illustration: a generic unbranded electric saloon at a vehicle handover forecourt. It does not depict a Tesla model or an actual Tesla delivery centre.
Tesla Q3 2026 production and deliveries
Tesla's official Q3 2026 release, published on 2 October, reports:
| Vehicle group | Production | Deliveries |
|---|---|---|
| Model 3 / Model Y combined | 457,387 | 478,237 |
| Other models combined | 7,004 | 8,295 |
| Total | 464,391 | 486,532 |
Quarter-on-quarter growth and a year-on-year decline
The comparison totals are 480,126 deliveries in Tesla's Q2 2026 release and 497,099 in its Q3 2025 release. AutoCred calculates that Q3 2026 deliveries rose 1.3% sequentially and fell 2.1% year on year, rounded to one decimal place.
The sequential comparison describes the change from the immediately preceding quarter. The annual comparison uses the corresponding period a year earlier. Read them together rather than treating either as a complete explanation of demand. The operational release alone does not isolate the reasons for the movement.
What the model mix does—and does not—show
From the Q3 table, AutoCred calculates that Model 3 and Model Y together accounted for 98.3% of deliveries. Tesla reports them as a combined group, so the table cannot establish either model's individual volume or India's contribution.
That distinction matters when a headline moves from company performance to a particular product. Ask whether the underlying disclosure actually separates the model or market being discussed. A combined figure is useful for understanding the business mix, but it cannot support a more detailed ranking on its own.
Put the EV shortlist in a practical budget. Use AutoCred's eligibility checker to check an indicative eligible amount and estimated EMI before shortlisting cars or visiting a dealer. Compare that indication with the local vehicle quotation and your charging arrangements.
Why deliveries exceeding production need careful interpretation
The same Q3 figures show 22,141 more deliveries than vehicles produced, calculated by subtraction. This is a comparison of activity during the quarter; it is not a complete statement of closing inventory. It should not be relabelled as an exact inventory reduction without the relevant inventory disclosure.
Tesla also cautions in its operational release that deliveries should not be treated as an indicator of quarterly financial results. Keep profitability and cash-flow conclusions separate until the corresponding financial evidence is available.
How Indian buyers should use the report
Use the global figures as market context. For a buying decision, verify the India configuration, written quotation, local delivery estimate and service arrangements directly. Neither a global delivery total nor its quarterly change establishes the waiting period or terms for a car available to you.
Match the purchase to a comfortable monthly commitment. Check your indicative eligibility and estimated EMI with AutoCred before finalising the shortlist or visiting the dealership. Results are indicative; final eligibility, rate, tenure and approval depend on the lender.